WHY A RADIUS IS ALWAYS WRONG
When deciding the most appropriate methodology for defining the trade area for your retail location, shopping center, or downtown, consider the following example of error associated with a ring or radius trade area definition.
A case study follows to illustrate the kind of error that can be associated with a radius trade area definition.
The following table displays the demographic attributes of 3, 5, and 7 mile radii of an arbitrary site:
| 3 Mile Radius | 5 Mile Radius | 7 Mile Radius | |
| Base Year Population | 62,278 | 168,503 | 312,390 |
| Current Year Population | 63,566 | 173,354 | 328,665 |
| Base to Current Year Population Growth | 2.10% | 2.90% | 5.20% |
| Current Year Median Household Income | $53,024 | $59,688 | $66,981 |
| Current Year % White Collar | 68.30% | 69.10% | 73.30% |
| Current Year % White | 55.90% | 71.90% | 80.40% |
Looking at the table above, one might consider the radii trade area to be a slightly better than average trade area with pretty homogenous characteristics. Population is above average, population growth is also above average, income looks good, there are a high number of white collar jobs. The trade area also appears to be racially diverse, especially close to the site.
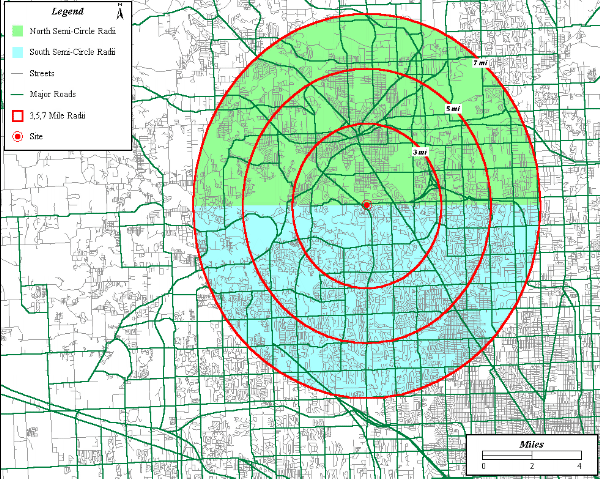
The map below displays the 3, 5, and 7 mile radii. The radii have been bisected to analyze the demographics of the north and south side of the radii.

The demographics of the north semi-circles, south semi-circles, and radii are displayed below:
3 Mile Radius
| 3 Mile Radius | 3 Mile North | 3 Mile South | |
| Base Year Population | 62,278 | 43,752 | 18,575 |
| Current Year Population | 63,566 | 44,232 | 19,386 |
| Base to Current Year Population Growth | 2.10% | 1.10% | 4.40% |
| Current Year Median Household Income | $53,024 | $35,018 | $160,102 |
| Current Year % White Collar | 68.30% | 56.70% | 90.70% |
| Current Year % White | 55.90% | 43.20% | 85.10% |
5 Mile Radius
| 5 Mile Radius | 5 Mile North | 5 Mile South | |
| Base Year Population | 168,503 | 104,147 | 64,356 |
| Current Year Population | 173,354 | 107,064 | 66,290 |
| Base to Current Year Population Growth | 2.90% | 2.80% | 3.00% |
| Current Year Median Household Income | $59,688 | $38,165 | $145,024 |
| Current Year % White Collar | 69.10% | 53.80% | 90.30% |
| Current Year % White | 71.90% | 61.20% | 89.20% |
7 Mile Radius
| 7 Mile Radius | 7 Mile North | 7 Mile South | |
| Base Year Population | 312,390 | 162,966 | 149,521 |
| Current Year Population | 328,665 | 172,907 | 155,869 |
| Base to Current Year Population Growth | 5.20% | 6.10% | 4.20% |
| Current Year Median Household Income | $66,981 | $45,199 | $103,662 |
| Current Year % White Collar | 73.30% | 58.20% | 87.90% |
| Current Year % White | 80.40% | 72.10% | 89.70% |
The north and south semi-circles are vastly different. Population seems to be higher in the north. Population growth close to the site is higher in the south and comparable farther away. Median household income is much higher in the south. White collar jobs are more prevalent close to the site. Racially, the north semi-circle is more diverse.
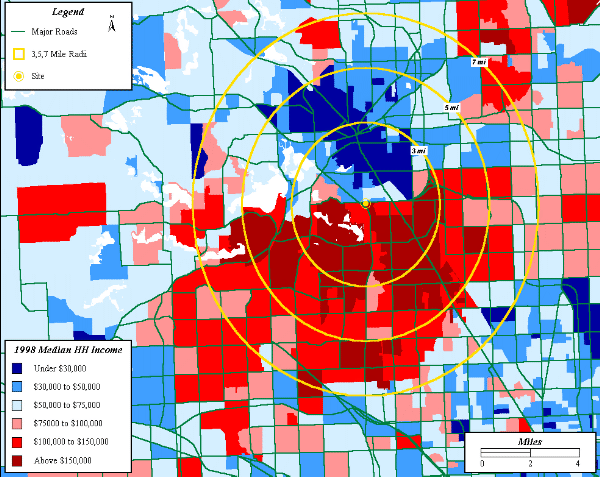
The following map displays the median household income of the the underlying block groups. The income variable is displayed in a cool to warm theme. Cool (blue colors) indicate low income and hot (red colors) indicate high income. Notice the large difference between the north and south semi-circles.

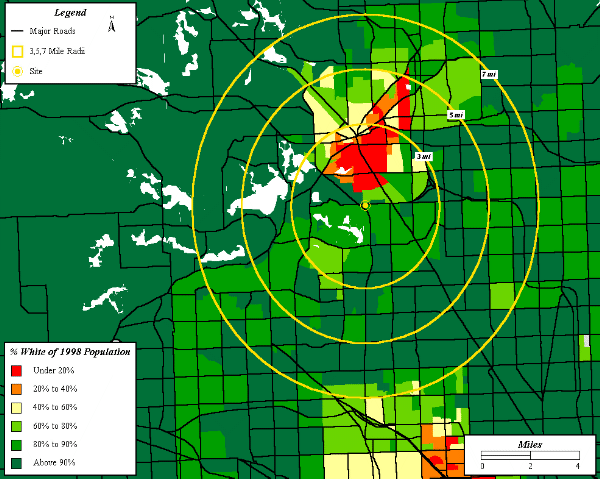
The following map displays the percentage of white population of the the underlying block groups. The race variable is displayed in a red to dark green theme. Notice the large difference between the north and south semi-circles.

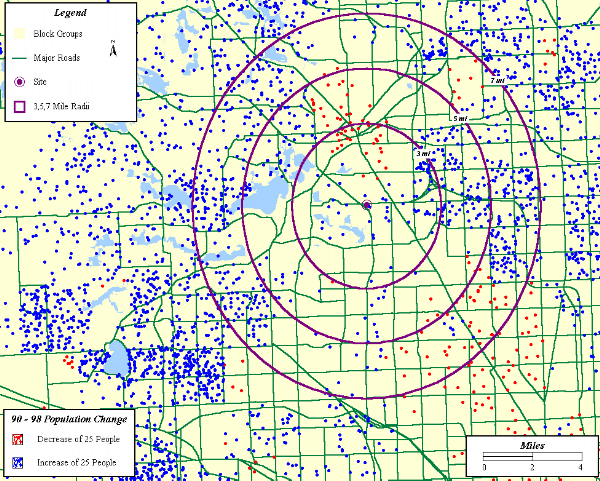
Lastly, the following map displays the population change of the the underlying block groups. Population change is displayed in a dot density theme with blue indicating an increase in population and red indicating a decrease in population. Notice the variation within the radii.

The objective of the above example was to show how population and demographic statistics at the radius level can be very misleading. A more accurate trade area definition reflecting population density, demographic variations, access and shopping patterns, and physical and psychological barriers can lead to a more precise understanding of the market your business is operating in.
1899 Orchard Lake Road, Suite 105
Sylvan Lake, MI 48320
Phone: 248-322-5555
Fax: 248-322-5564
Email: TSE@thestrategicedge.com